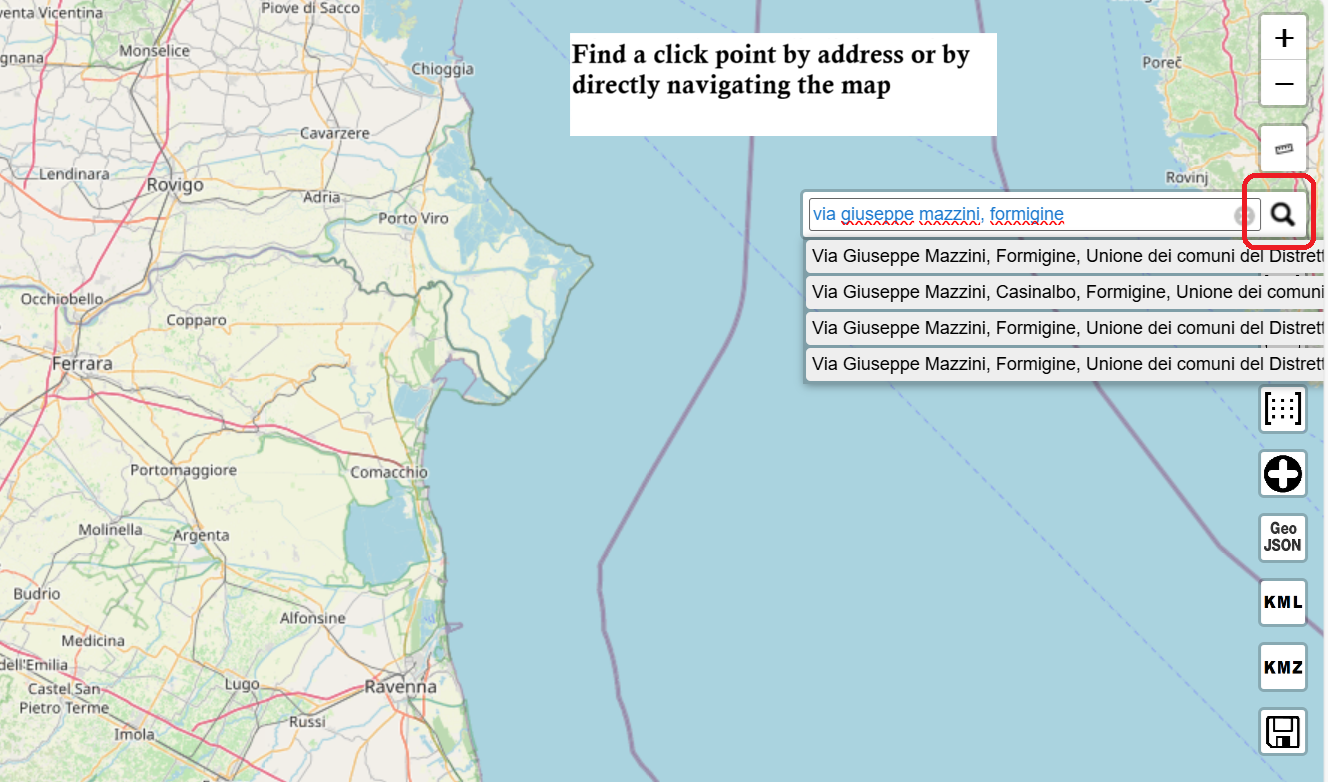
Search analysis point
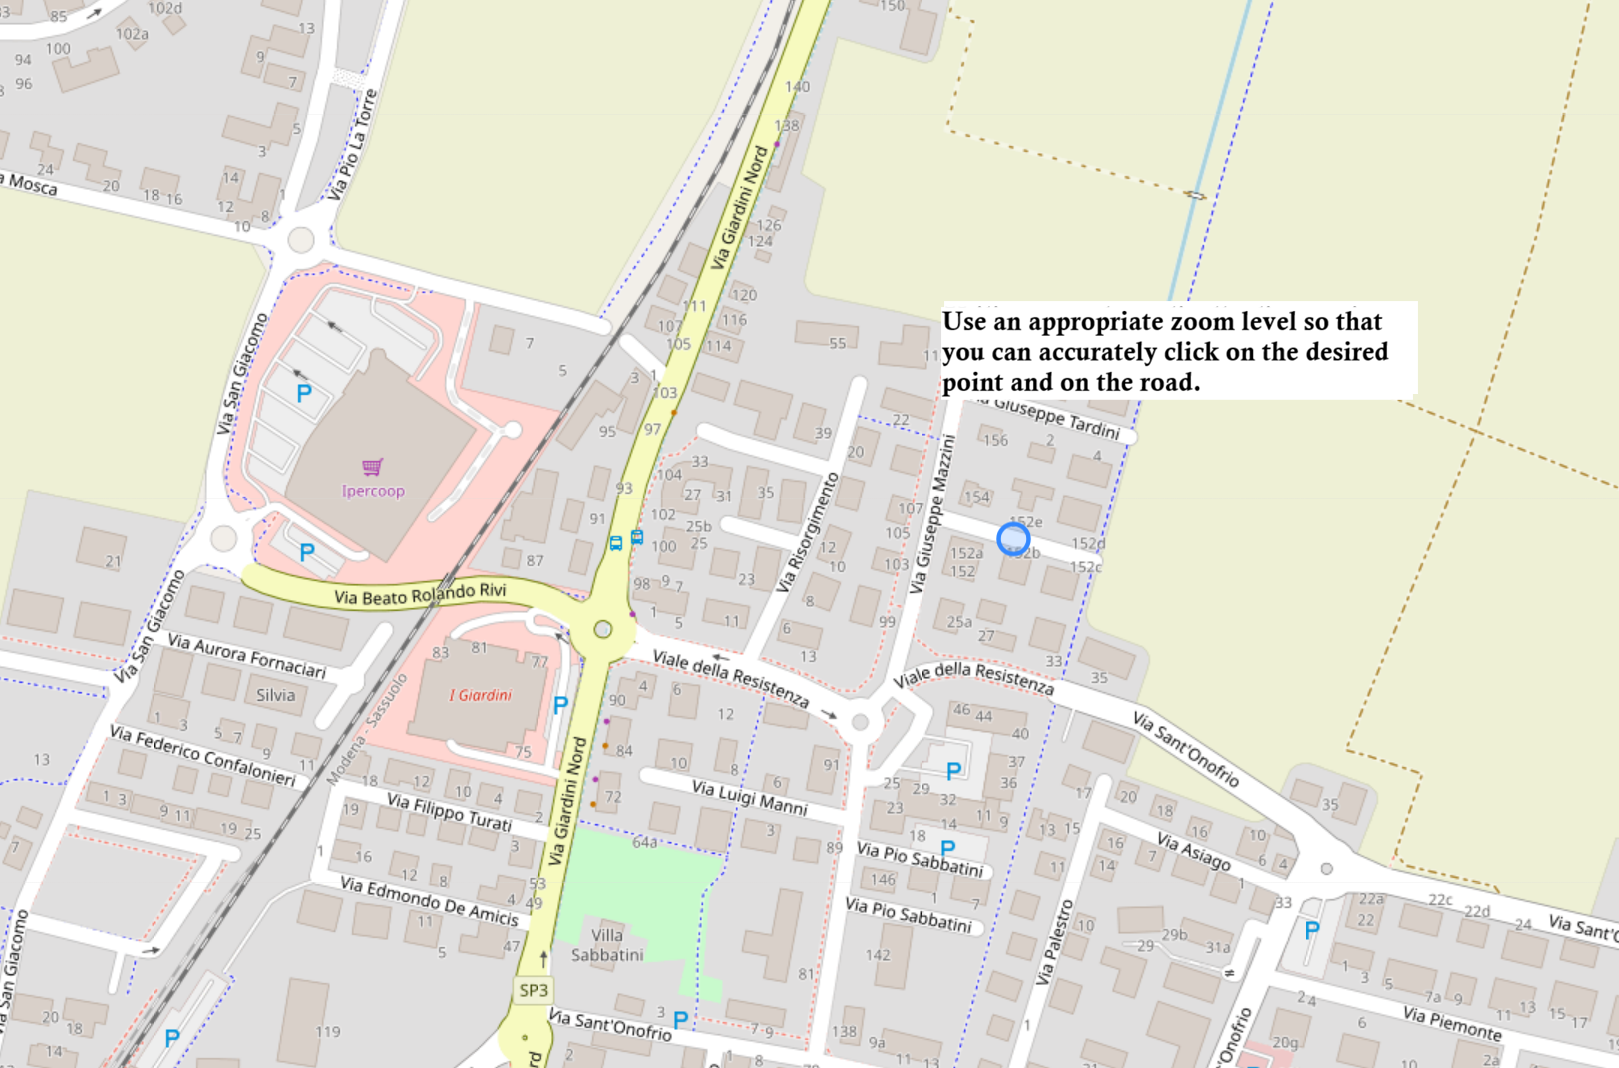
Good zoom level for clicking on a road
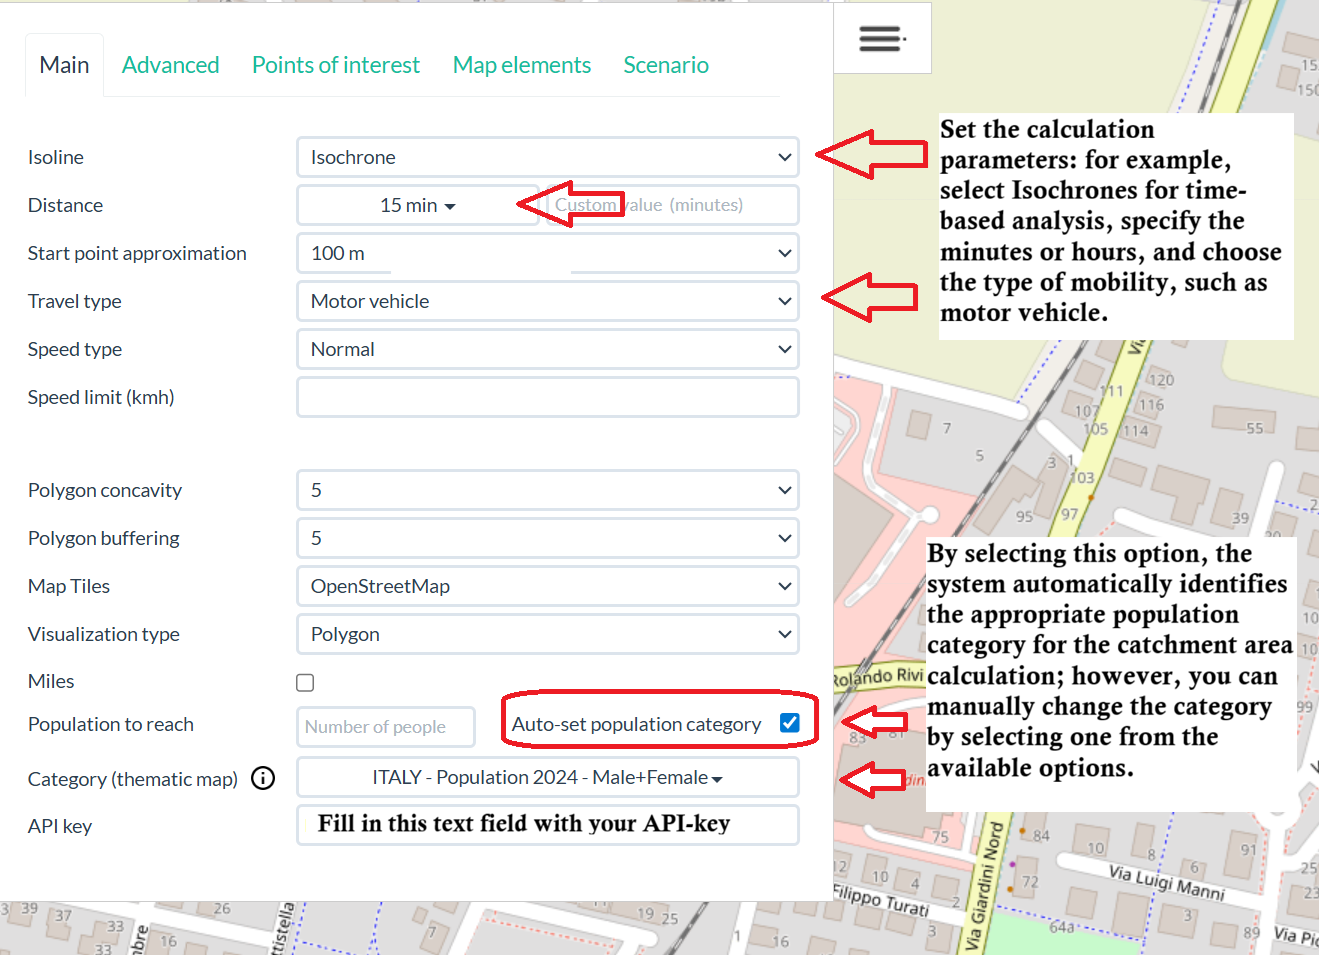
Set parameters, category and API-Key
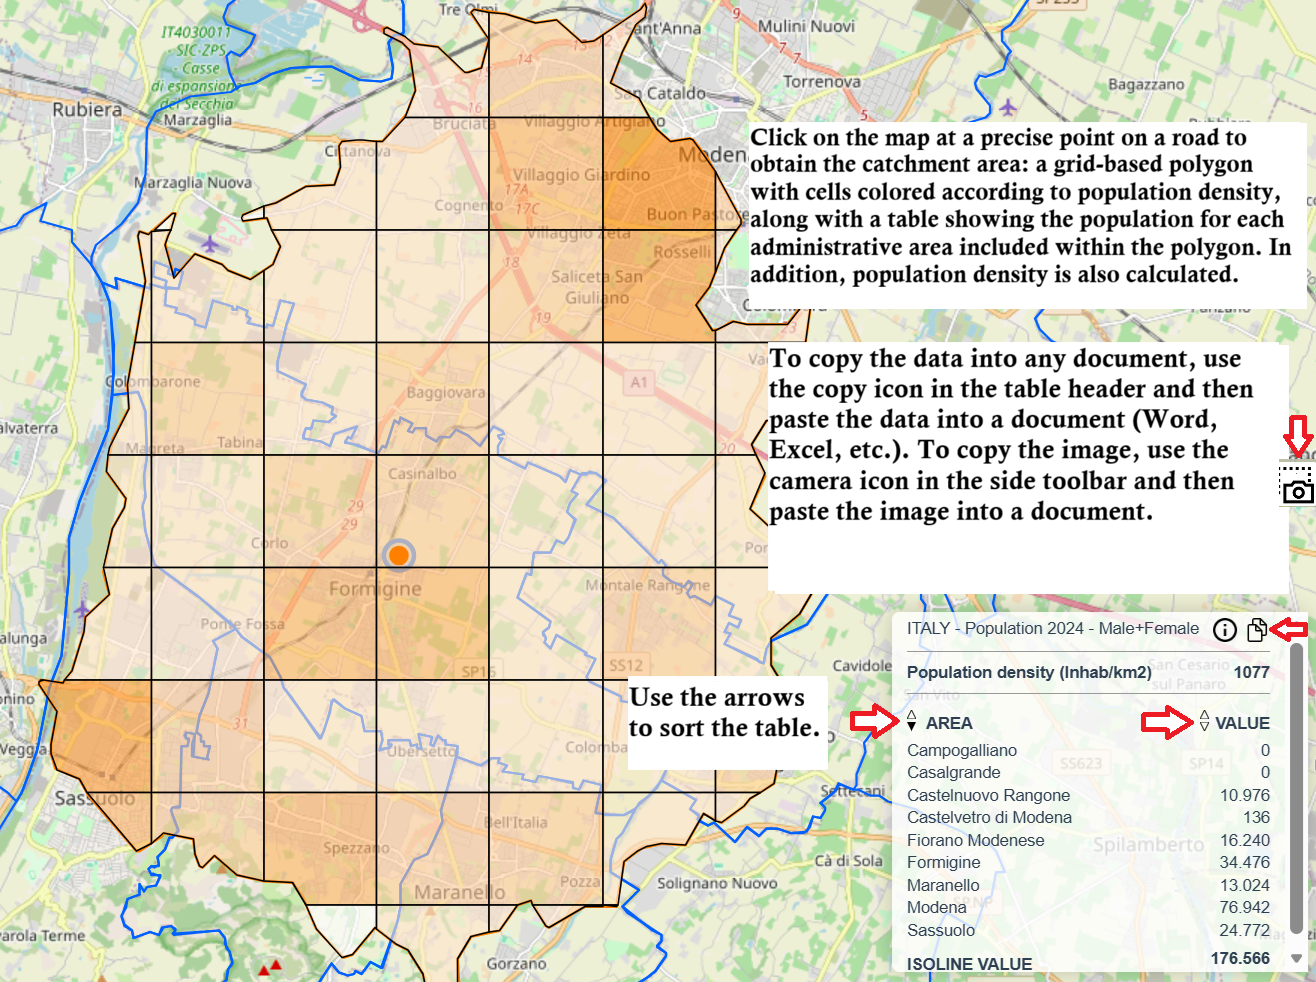
Click on the analysis point to get the result
Recalculate by adding the distance between click and common
Territorial and demographic study of the reference area using the Iso4app platform.
Example of using isochrones (areas reachable within a given travel time or distance).
Using motor vehicle travel.
Inhabitants within the catchment area.
Average urbanization indicator..
Iso4app is a simple and intuitive web application — only a few clicks are needed to get results.
Navigate to the ISO4APP map interface with menu and toolbar. Move the map or search for an address  to place your analysis point.
Open the menu  and configure: isochrone by travel time, isodistance by distance; enter the travel time or distance value; choose travel mode: Motor vehicle,Bicycle, Pedestrian.
You can also select automatic population categorization based on map position by checking Auto-set population category or choose it manually if available for the selected country.
With parameters set, click on the map near your analysis point.
The resulting graphic is the reachability polygon relative to the set parameters. The polygon is divided into a grid with a more or less intense color to indicate the population density. Hovering the mouse pointer over a square in the grid displays a pop-up window with the population value within the square. Additionally, the municipal boundaries below the resulting polygon are displayed.
The resulting text is a table in which each row corresponds to a municipality with its corresponding population value at the intersection of the municipal border and the resulting polygon. At the end of the table is the sum, or total population within the resulting polygon. Additionally, the population density, or inhabitants per square kilometer, is calculated.
 icon and then paste it into a document. To copy the data table, use the
  icon in the table header and then paste it into a document (Word, Excel, etc.).
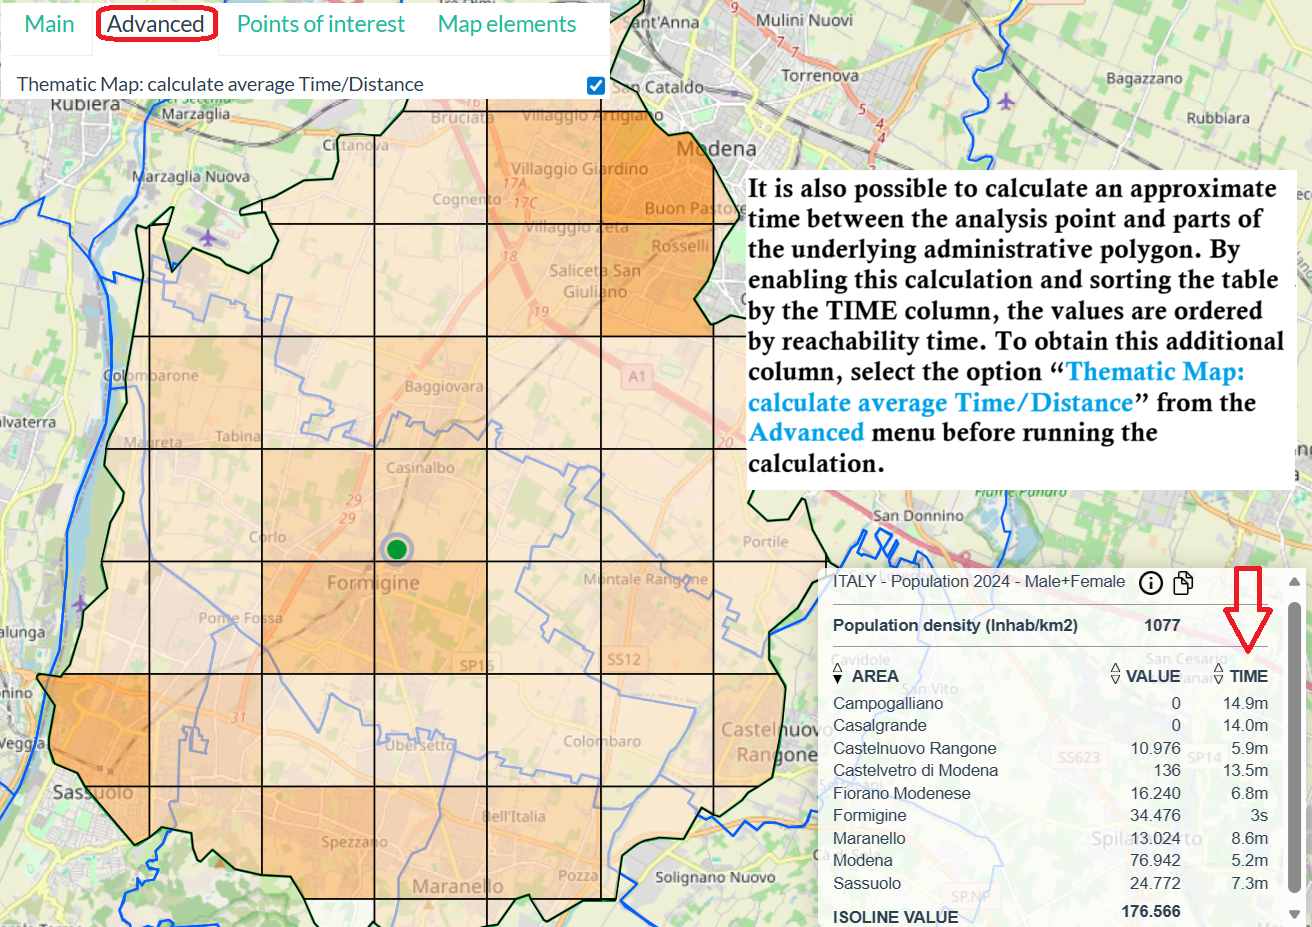
You can also sort the table using the arrows next to the column. Additionally, you can calculate the approximate time/distance between the analysis point and the relevant municipal area. To enable this calculation, select the Thematic Map: calculate average Time/Distance option in the Advanced menu before executing the calculation.
icon in the table header and then paste it into a document (Word, Excel, etc.).
You can also sort the table using the arrows next to the column. Additionally, you can calculate the approximate time/distance between the analysis point and the relevant municipal area. To enable this calculation, select the Thematic Map: calculate average Time/Distance option in the Advanced menu before executing the calculation.
Iso4app has not received any funding of any kind. It relies solely on the work of its people and can only remain active thanks to your contributions. After registering, you can perform some user base calculations for up to 30 minutes or 30 kilometers for free, simply to test the platform.
Iso4app's economic policy is based on credit consumption. For example, you purchase 16,000 credits with a duration of one year at a cost of 100 euros. A 30 minutes isochrone consumes approximately 118 credits, allowing you to perform over 130 analyses. As analysis time increases, the credits consumed increase accordingly. You can find the credit consumption table at the following link: plan and credit consumption
Register at the provided registration link: REGISTRATION
Contact for questions or information at INFO@K-SOL.IT